

User Research: 3 Methods of Efficient User Research! (Episode 2)
Introduction
User research can help us better understand user needs and promote the iteration of products and design schemes on this basis. So, what can we do to improve the efficiency of user research?
In the last article, we learned how to make a plan in the early stage of research. This article shares how to examine the research process from the perspective of users when entering the stage of formal research.

The author of User Experience Management once said: "know your users, but you are not your users."
1. Understand the user
1. Step 1: create a comfortable research atmosphere
In the research, how to make users actively cooperate with our research through a good atmosphere? We can do it with these three things.
1. Use the opening remarks to get closer to the user
The opening remarks include: self introduction (including your name and work content), research purpose (describe our research purpose to users), user self introduction (invite users to briefly introduce them); Through this process, one-to-one cooperation with users can be established!
Our opening remarks can go something like this:

2. Prompt the rules of user research to reduce user anxiety
You can prompt the user for the following rules:
- Express one's true thoughts;
- There is no right or wrong answer;
- Briefly describe the process and time of the entire survey, and give users certain expectations.

3. Express gratitude
At the end of the survey, fully expressing gratitude to users can enhance the user's impression of the platform. If you have prepared gifts in advance, you can give them in this link.
Here's a snippet of what I often say to users after a research campaign is over.
For gifts, we recommend portable gifts that everyone can use, such as gift cards, or coupons.

2. Step 2: design problems that fit the user's thinking
In most research methods, asking users questions is a very important part of the research process. I have summarized the contents of the 4 questions that need attention, and then I will explain in detail.

1) Keep it easy to understand
When asking a question, the wording is very important. The language used in the question should be as simple as possible, and do not use complex and abstract technical terms or concepts.
The "air ticket tying product" mentioned in the following question is a complex and abstract professional term for the user, which will cause the user to not understand the problem itself. If it is replaced with daily words such as "airport VIP lounge" and "quick security check", it will be easier for users to understand.

2. Avoid tendentious or inducing questions
If the question contains words such as social title, authority status, occupation, emotional content, etc., it will also affect the user's understanding of the question and the choice of the answer.
For example, in the following question, "domestic expert" is a relatively obvious social title. This question is asked with the expectation that users tend to agree. The question would be more objective if we replaced it with non-inducing words like "someone".

3. Avoid asking complex questions
To put it simply, avoid asking multiple things at once in a question. The following question mentions three softwares, which can make people wonder which one to choose. In this case, try to ask separate questions, such as have you used other software? Which software are you using?

4. From simple to complex
In terms of the order of questions, we should follow the order from simple to complex questions, so that users can adapt to the research activities faster.

3. Step 3: Provide reasonable answers to users
In our research, we need to design not only questions, but also answers. When designing answers, I suggest you pay attention to the following three points.
1. The answer should be in line with the actual situation.
For example, in the following error case, the hotel room fee of more than $100K does not meet our actual consumption.

2. Answers must be exhaustive and mutually exclusive
The answer choices provided must not be omitted or overlapped. In the following error cases, the option of experiential accommodation is omitted. If we cannot predict all the answers, we can provide an option of [Other] to make the answer more comprehensive.

3. The answers to the questions should be arranged in a certain order

4. Step 4: Before the formal investigation, do a small-scale test
Giving the research materials to colleagues and asking them to ask some questions from the perspective of ordinary users can improve the success rate of formal research!
2. Improving Efficiency: Write Reporting
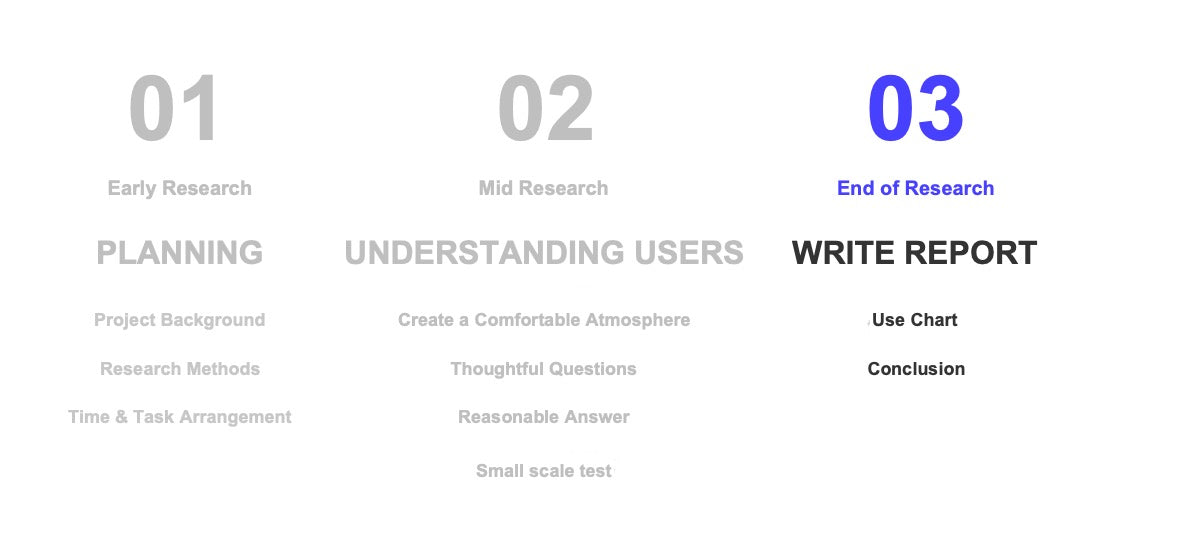
In the summary report, how to efficiently complete the research report and clearly communicate your research conclusions to others? I recommend two practical tips.
1. Use charts
In research and analysis, charts play a very important role, not only allowing the other party to see the differences in data more intuitively, but also helping us to show the relationship and meaning between the data. Below, I will introduce the usage scenarios of 4 common charts.
The first: pie charts.
The pie chart expresses the proportion of data through the size of the area of the circle chart, which is suitable for emphasizing the proportion of a certain data in the whole. As can be seen from the figure below, male users account for a higher proportion than female users, and the proportion is more than half of the overall.

Second: bar chart
It compares the differences between the data through the height or width of the histogram, and I will use it to highlight the top few in the data in the research report. In the chart below, we can intuitively see that the top 4 most commonly used hotel booking platforms.

Third: Line chart
Line chart is to express the overall characteristics of data with the change of lines. It is suitable for emphasizing the data that changes over time.
For example, on the right is the trend chart of the click-through rate of a certain page in the past six months. From the chart, we can see that the click-through rate has increased significantly after the new version was launched at the end of August.

2. Adopt a conclusion-first reporting structure
Conclusion first means: when writing the report, inform the audience of your conclusion in advance, and then describe the event in detail, so that the audience can understand what you want to express with the least amount of brain power.
The image below is one of my most commonly used report presentation formats. You can use it as a reference.

The above are the three major contents that I have shared to improve the efficiency of research. I hope it will help you in your future research.
If you like the article, please share it with others with page link, thanks for your supporting! ❤
Recommendation of Related Axure Products


Thanks for wonderful information I was looking for this info for my mission.
Leave a comment